If you’ve been doing pretty well on SAT math problems without Desmos: “Why should I bother learning Desmos?”
Here’s the truth: the Digital SAT isn’t just a paper test on a screen — it’s an environment where the right tools can give you speed, accuracy, and confidence. Desmos, the built-in graphing calculator on the Digital SAT, is one of those tools. And it’s not just for students who “can’t” solve without it — it’s for students who want every possible advantage.
Think of it like running a race: you might be able to run barefoot, but wearing high-performance running shoes can help you run faster and with fewer mistakes.
Why Even Strong Math Students Need Desmos
Time Efficiency – On test day, speed matters. Desmos can check your work in seconds, so you don’t waste precious minutes re-solving problems.
Error Prevention – Even top students make tiny calculation slips. Graphing or checking with Desmos catches those before you hit “Submit.”
Better Visualization – Many SAT questions hide the answer in how a graph behaves. Desmos makes patterns obvious instantly.
Complex Problems Made Simple – Systems of equations, inequalities, or word problems involving graphs are much easier when you can see them.
Getting Comfortable Before Test Day
Go to desmos.com/practice and select the College Board tests. This is the exact interface you’ll see on test day.
Practice not only solving problems in your usual way but also quickly checking or confirming with Desmos.
Build a habit: when you read a problem, ask yourself, “Could Desmos make this faster or safer?”
Example 1: Solving a Linear Equation Word Problem
Let’s say you get a problem like:
Two cell phone plans are compared. Plan A charges $20 per month plus $0.10 per text. Plan B charges $15 per month plus $0.15 per text. For how many texts will the two plans cost the same?
Without Desmos, you might write: 20 + 0.10x = 15 + 0.15x
and solve algebraically. That works — but Desmos lets you:
Type both equations directly into the graph.
See exactly where they intersect.
Click the intersection point to find x = 100 texts instantly.
This means less mental load and fewer chances to mess up.
Example 2: Using Sliders to Explore Constants
Some SAT Algebra questions ask: “For what value of a will this system have no solution?”
Example:
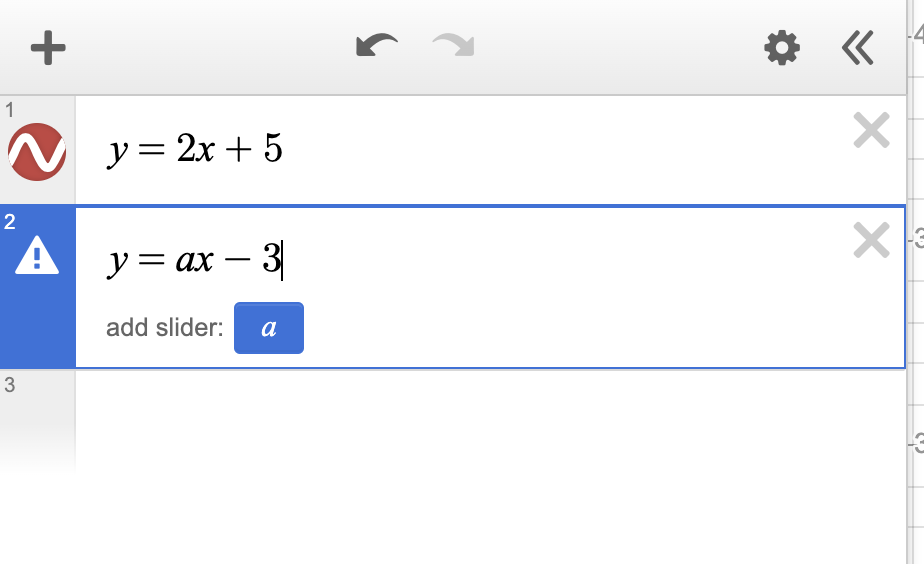
y = 2x + 5y = ax - 3
Here’s how Desmos makes this quick:
Type both equations into Desmos.
When you enter a (instead of a number), Desmos will offer to create a slider for it. Click Add Slider.
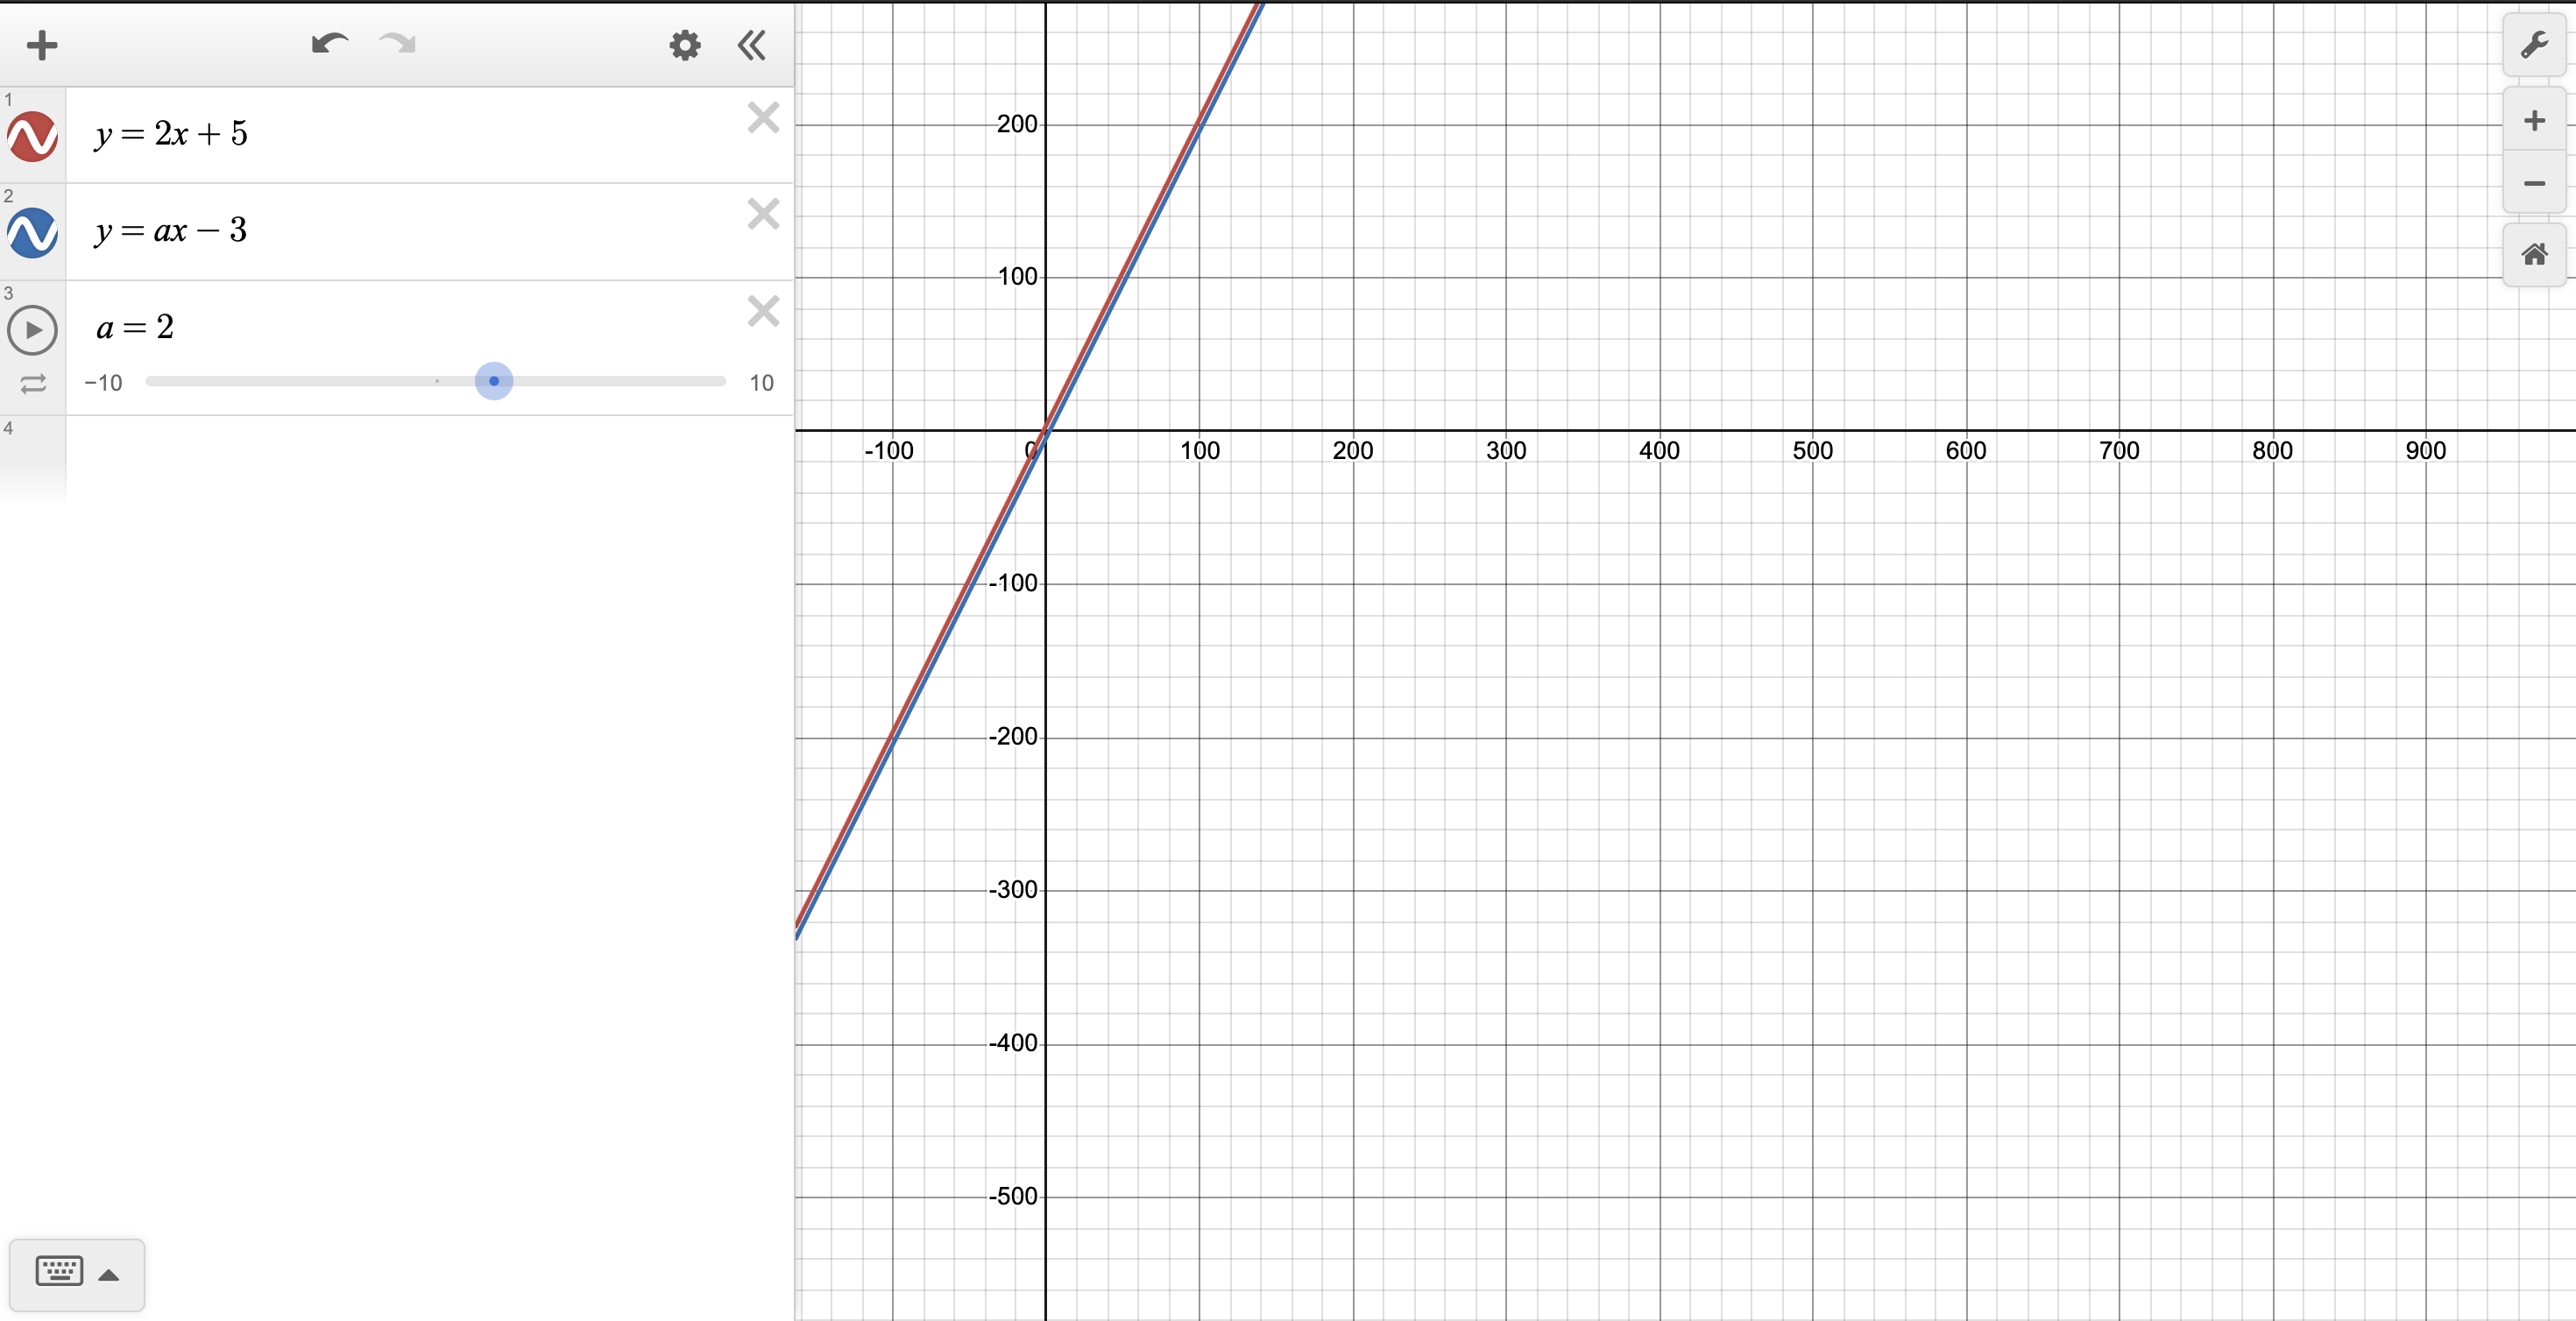
Move the slider until the two lines are parallel (same slope, never intersect).
Read the value of a directly — that’s your answer.
This turns a possibly tricky algebra manipulation into a simple visual match.
Example 3: Solving Systems of Equations Instantly
Suppose the SAT gives:
3x + 2y = -8x - y = 5
Traditionally, you might use substitution or elimination.
With Desmos:
Enter both equations.
The point where they intersect will appear automatically.
Click that point to see (x, y) = (2.2, -2.8) instantly.
This is especially powerful for word problems where the system is hidden in context — once you translate the words to equations, you can get the solution in seconds.
Example 4: Visualizing Inequalities
You might see something like:
y > 2x - 1y <= -x + 4
With Desmos:
Type both inequalities exactly as written.
The overlapping shaded region is the solution set.
If the problem asks whether a point, say (1, 3), is a solution, just see if it lies in the shaded region.
No need to do multiple substitutions and sign checks — the graph tells you instantly.
Example 5: Checking Linear Relationship Word Problems
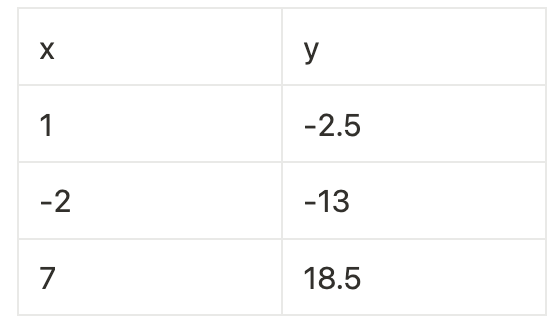
Sometimes the SAT will give a table of values and ask for the equation of the line.
Example table:
In Desmos:
Click the “+” → Table.
Enter the x and y values.
In a new line, type: y1 ~ m x1 + b
Desmos will show m and b (slope and intercept) instantly — here, m = 3.5, b = -6
Example 6: Solving Absolute Value Equations
Say the SAT gives:
|2x - 8| = 10
With Desmos:
Click the keyboard icon in the bottom-left corner.
Tap the absolute value symbol
Enter 2x - 8 = 10 inside the bars.
The graph will cross the x-axis at the solutions.
Click the intercepts to read x = -1 and x = 9.
No splitting into two separate equations — one quick visual does it.
Example 7: Fraction Shortcut
If you solve something and get a messy decimal like 0.428571...,
Click the fraction symbol in Desmos.
Instantly see the fraction 3/7.
This is great for SAT questions that ask for exact fractional answers.
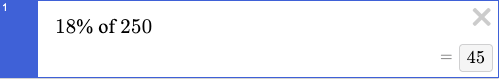
Example 8: Percent Calculation Shortcut
Want 18% of 250?
Type 18%250 directly into Desmos.
It will instantly show 45.
This can save you from multiplying decimals under time pressure.
Example 9: Last-Minute Answer Check
Even if you solve a problem algebraically, you can:
Type your equation(s) into Desmos.
Click the graph to verify the solution matches your work.
If the point of intersection or the shading doesn’t match what you calculated — you caught a mistake before submitting.
Think of Desmos not as a “cheat code,” but as a second brain during the SAT— one that never gets tired, never forgets a step, and never makes careless arithmetic mistakes.
Even if you’re strong without it, mastering Desmos is like carrying an umbrella on a cloudy day — you might not need it, but when you do, you’ll be very glad it’s there.